


TABLE OF CONTENT
Introduction
Data Wrangling and Data Cleaning
Exploratory Data Analysis/ Dashboard Presentation
Conclusion
References
INTRODUCTION
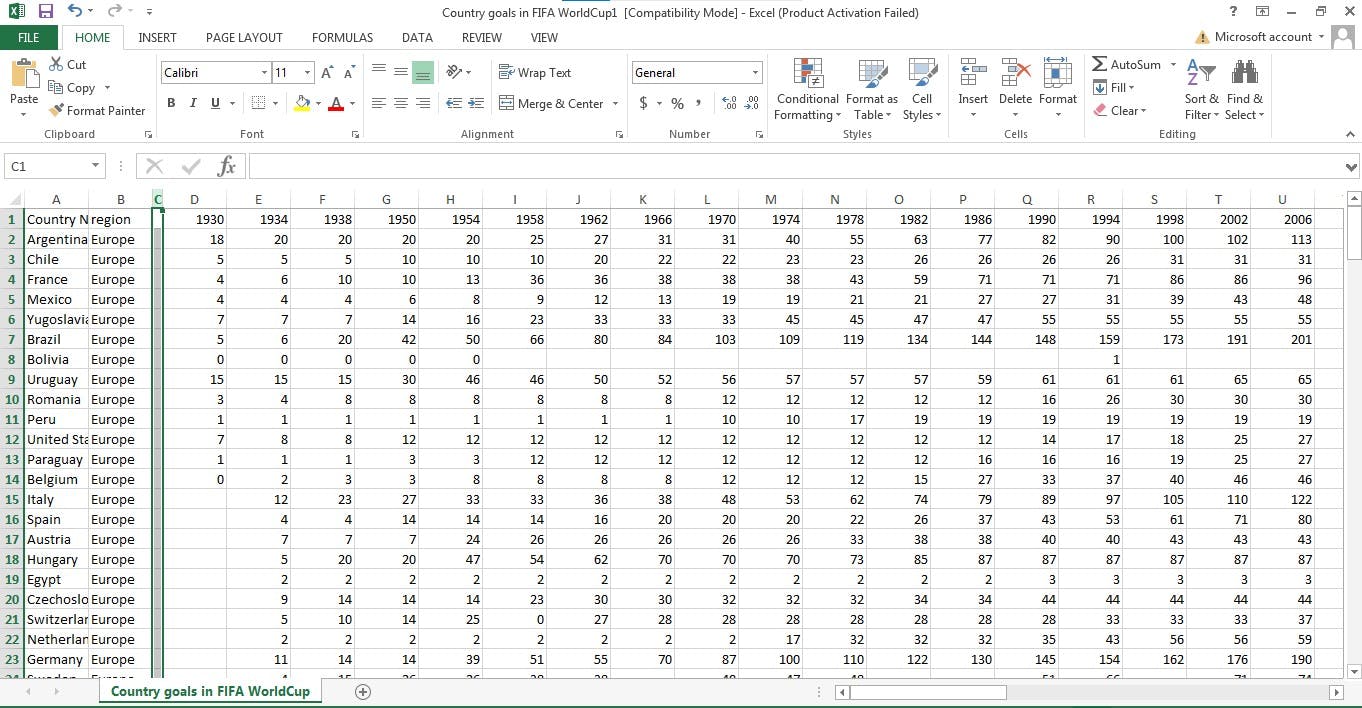
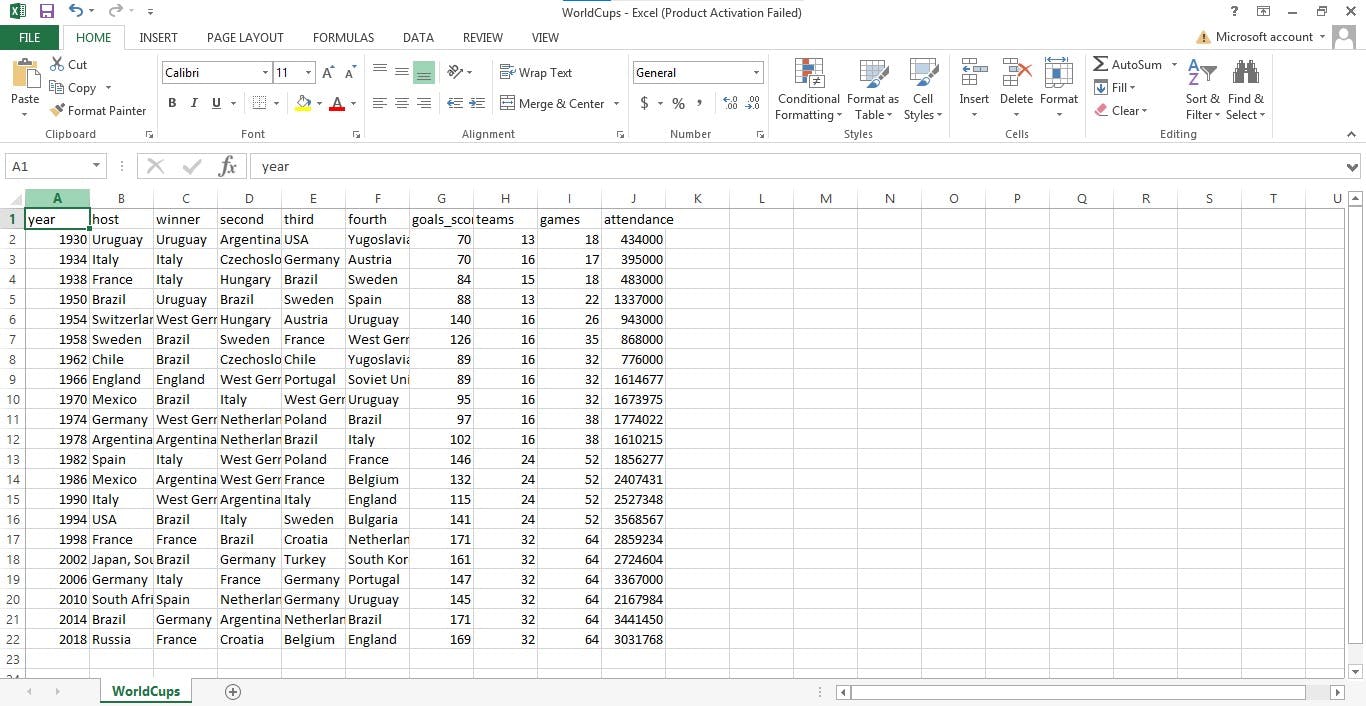
The dataset used in this project by The Achievers Team was gotten from Kaggle. It was for the year 1930-2018. We got three datasets which are FIFA World Cup Dataset, Country Goals in the World Cup and Countries with World Cup won Dataset.
DATA WRANGLING AND DATA CLEANING
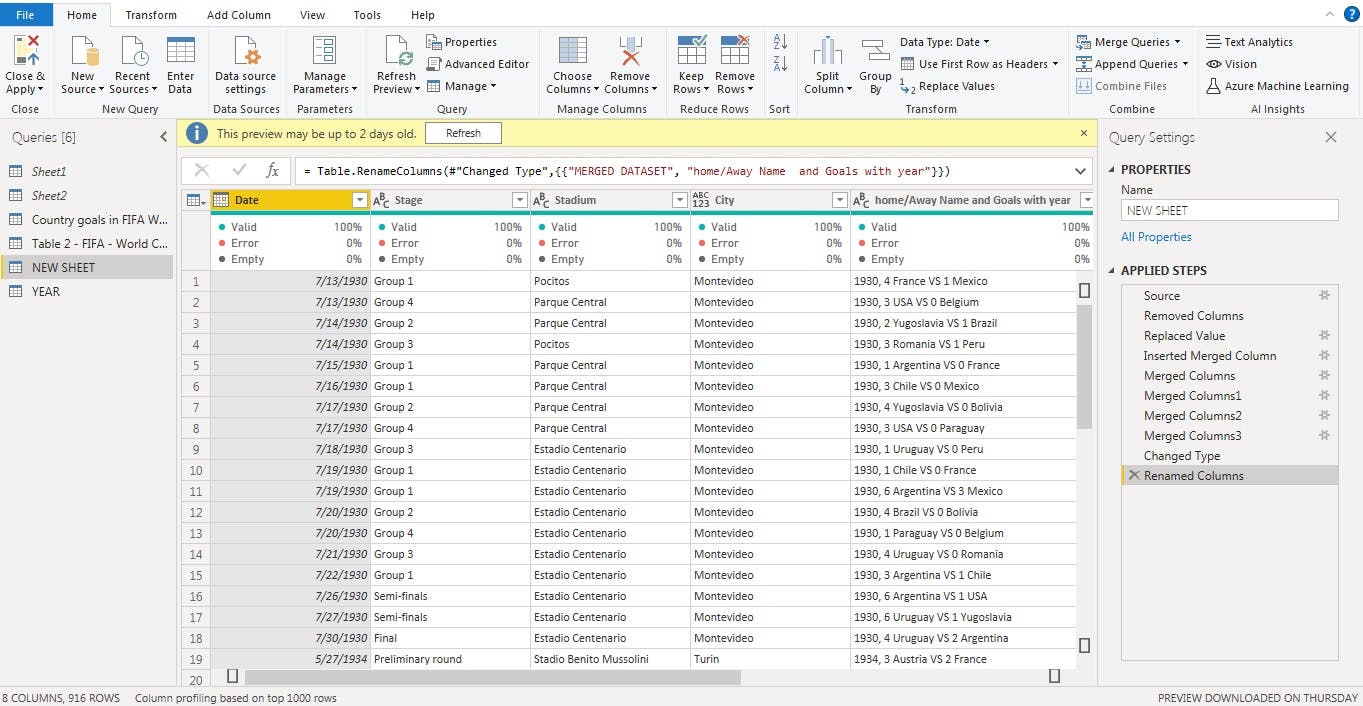
The three Datasets from above content were appended using Power Query. we also had to merge Home goals and name with the away goals and name with the year to be under one column.
EXPLORATORY DATA ANALYSIS/DASHBOARD PRESENTATION
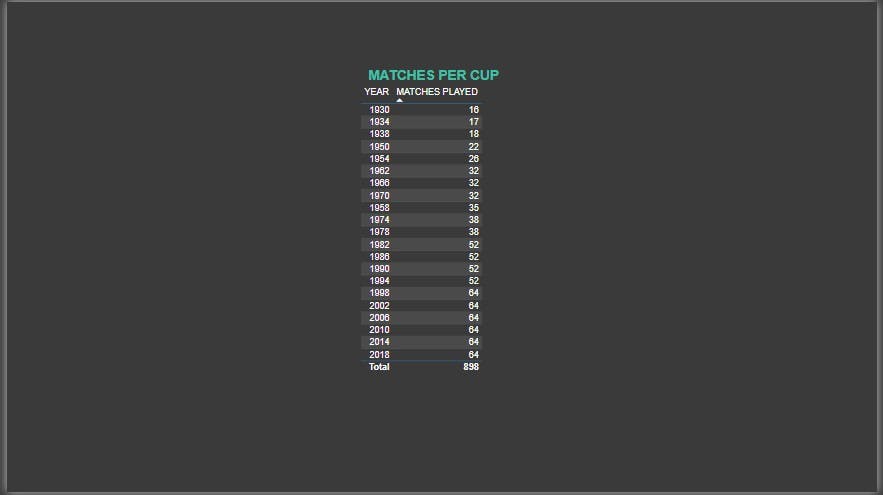
MATCHES PER CUP
using the Table Chart, we were able to show the number of matches played in each world cup.
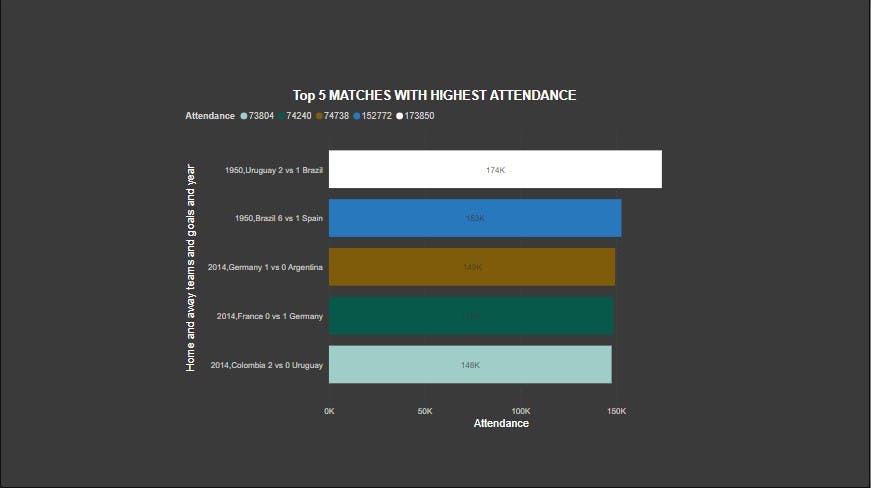
MATCHES WITH THE HIGHEST ATTENDANCE
Using the Stacked Bar Chart, the analysis showed the matches played with the highest attendance. we added the year and score line to know the actual result of each final played.
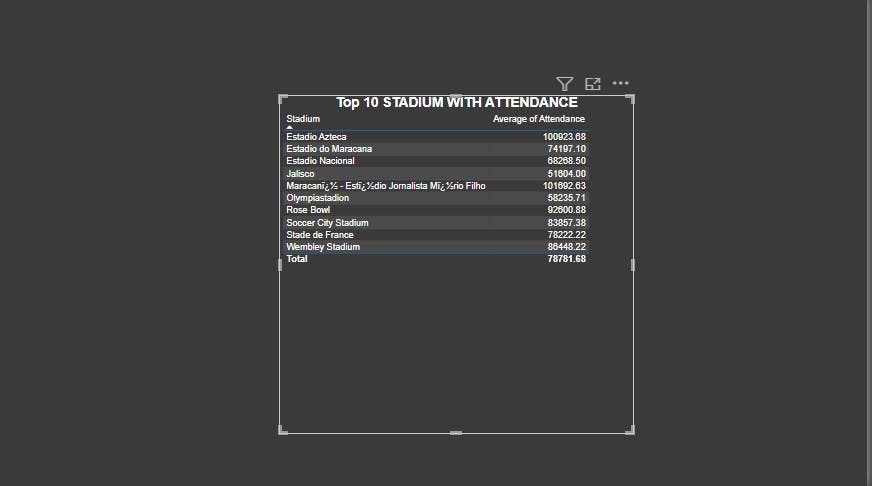
STADIUM WITH THE HIGHEST AVERAGE ATTENDANCE
Using the Table Chart, the analysis showed the stadium with the highest average attendance which was Maracanã in Brazil.
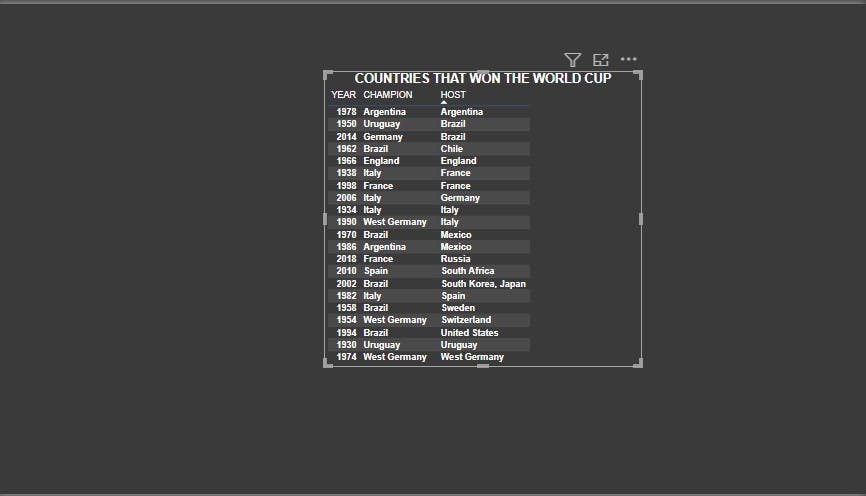
COUNTRIES THAT WON THE WORLD CUP
The analysis for the countries that won the world cup was shown with the aid of the Table Chart, we realized that Brazil had the highest number of World Cups won.
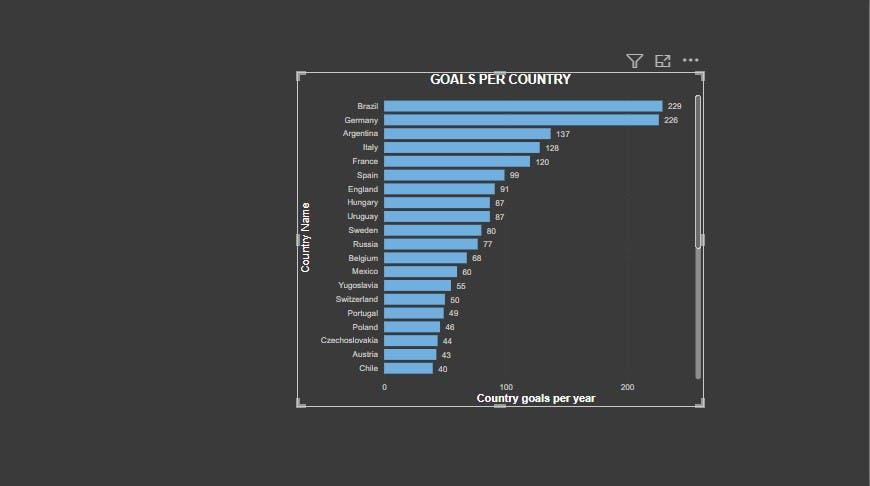
NUMBER OF GOALS PER COUNTRY
Using the Stacked Bar Chart, the number of goals per country was gotten in this analysis. Brazil had the highest number of goals which was shown to be 229.
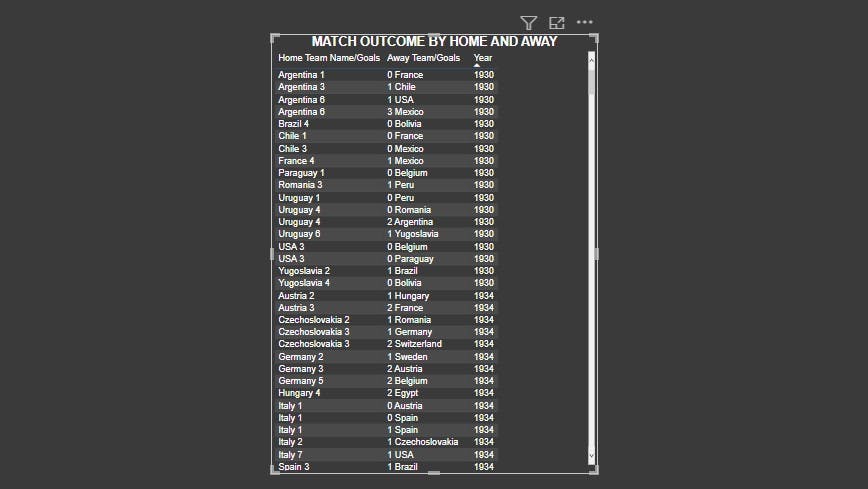
MATCH OUTCOME BY HOME AND AWAY
The analysis for the match outcome by home and away was shown with the aid of the Table Chart, which includes the score line and the year it was played.
DASHBOARD PRESENTATION
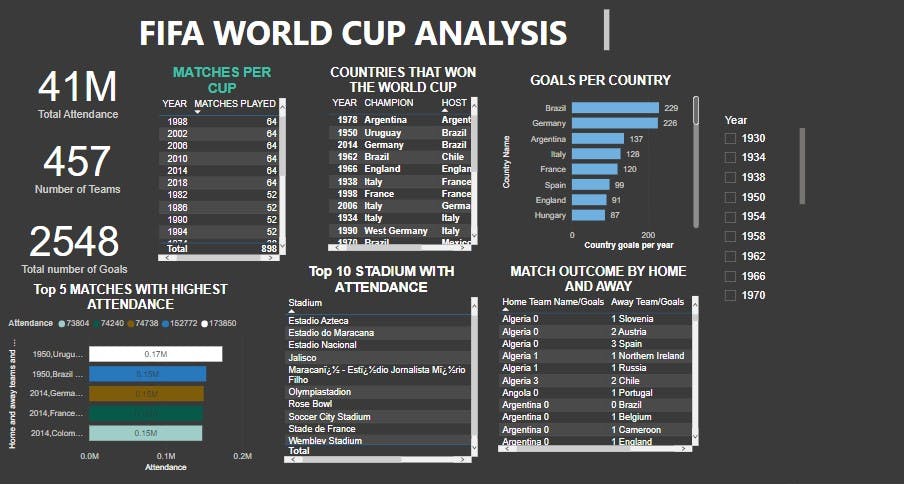
FIFA WORLD CUP ANALYSIS
CONCLUSION
The FIFA World Cup Analysis between 1930-2018 showed that the total number of teams that qualified for the world cup was 457 teams, the total number of goals scored was 2548, while the total number of attendance in between those years was 41m. we realized that Brazil had the highest number of world cups won, highest number of goals and also the highest average attendance for the world cup years.
REFERNCES
SIDEHUSTLE TEAM 3 @Temmy @Joy @Busayo @Nkem @Alonge @Toluserah